
Regents Physics - Motion Graphs
Graphs and diagrams are terrific tools for understanding physics, and they are especially helpful for studying motion, a phenomenon that we are used to perceiving visually. We'll explore motion through the study of particle diagrams, displacement-time graphs, velocity-time graphs, and acceleration-time graphs.
Particle Diagrams
Particle Diagrams, sometimes referred to as ticker-tape diagrams or dot diagrams, show the position or displacement of an object at evenly spaced time intervals. Think of a particle diagram like an oil drip pattern... if your car has a steady oil drip, where one drop of oil falls to the ground every second, the pattern of the oil droplets on the ground could represent the motion of your car with respect to time.
By examining the oil drop pattern, a bystander could draw conclusions about the displacement, velocity, and acceleration of your car, even if they weren't able to watch your car drive by! The oil drop pattern is known as a particle, or ticker-tape, diagram.

From the particle diagram we can see that your car was moving either to the right or the left, and since the drops are evenly spaced, we can say with certainty that your car was moving at a constant velocity, and since velocity isn't changing, acceleration must be 0.
So what would the particle diagram look like if your car was accelerating to the right? Let's take a look and see!
The oil drops start close together on the left, and get further and further apart as the object moves toward the right. Of course, this pattern could also have been produced by a car moving from right to left, beginning with a high velocity at the right and slowing down as it moves toward the left. Because the velocity vector (pointing to the left) and the acceleration vector (pointing to the right) are in opposite directions, the object slows down. This is a case where, if you called to the right the positive direction, the car would have a negative velocity, a positive acceleration, and it would be slowing down. Check out the resulting particle diagram below!

Thought Question: Can you think of a case in which the car could have a negative velocity and a negative acceleration, yet be speeding up? Draw that case!
Displacement-Time Graphs
As you've observed, particle diagrams can help you understand an object's motion, but they don't always tell you the whole story. We'll have to investigate some other types of motion graphs to get a clearer picture.

The displacement time graph (also known as a d-t graph or position-time graph) shows the displacement (or, in the case of scalar quantities, distance) of an object as a function of time. Positive displacements indicate the object’s position is in the positive direction from its starting point, while negative displacements indicate the object’s position is opposite the positive direction. Let’s look at a few examples.
Suppose Cricket the WonderDog wanders away from her house at a constant velocity of 1 m/s, stopping only when she's 5m away (which, of course, takes 5 seconds). She then decides to take a short five-second rest in the grass. After her five second rest, she hears the dinner bell ring, so she runs back to the house at a speed of 2 m/s. The displacement-time graph for her motion would look something like this:
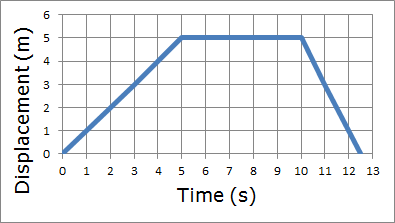
As you can see from the plot, Cricket's displacement begins at zero meters at time zero. Then, as time progresses, Cricket's displacement increases at a rate of 1 m/s, so that after one second, Cricket is one meter away from her starting point. After two seconds, she's two meters away, and so forth, until she reaches her maximum displacement of five meters from her starting point at a time of five seconds. Cricket then remains at that position for 5 seconds while she takes a rest. Following her rest, at time t=10 seconds, Cricket hears the dinner bell and races back to the house at a speed of 2 m/s, so the graph ends when Cricket returns to her starting point at the house, a total distance traveled of 10m, and a total displacement of zero meters.
As we look at the d-t graph, notice that at the beginning, when Cricket is moving in a positive direction, the graph has a positive slope. When the graph is flat (has a zero slope) Cricket is not moving. And when the graph has a negative slope, Cricket is moving in the negative direction. It's also easy to see that the steeper the slope of the graph, the faster Cricket is moving.
Velocity-Time Graphs
Just as important to understanding motion is the velocity-time graph, which shows the velocity of an object on the y-axis, and time on the x-axis. Positive values indicate velocities in the positive direction, while negative values indicate velocities in the opposite direction. In reading these graphs, it’s important to realize that a straight horizontal line indicates the object maintaining a constant velocity – it can still be moving, it’s velocity just isn’t changing. A value of 0 on the v-t graph indicates the object has come to a stop. If the graph crosses the x-axis, the object was moving in one direction, came to a stop, and switched the direction of its motion. Let's look at the v-t graph for Cricket the Wonderdog's Adventure from the d-t graph section:
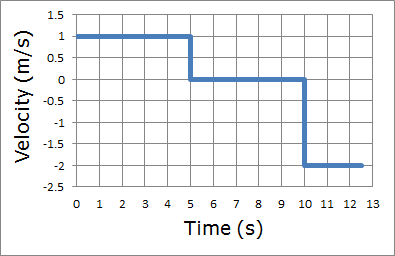
For the first five seconds of Cricket's journey, we can see she maintains a constant velocity of 1 m/s. Then, when she stops to rest, her velocity changes to zero for the duration of her rest. Finally, when she races back to the house for dinner, she maintains a negative velocity of 2 m/s. Because velocity is a vector, the negative sign indicates that Cricket's velocity is in the opposite direction (we initially defined the direction away from the house as positive, so back toward the house must be negative!)
As I'm sure you can imagine, the d-t graph of an object's motion and the v-t graph of an object's motion are closely related. We'll explore these relationships in the next section.
Graph Transformations
In looking at a d-t graph, the faster an object’s displacement changes, the steeper the slope of the line. Since velocity is the rate at which an object’s displacement changes, the slope of the d-t graph at any given point in time gives you the velocity at that point in time. We can obtain the slope of the d-t graph using the following formula:
Realizing that the rise in our graph is actually ∆v, and the run is ∆t, we can substitute these variables into our slope equation to find:
With a little bit of interpretation, it’s easy to show that our slope is really just displacement over time, which is the definition of velocity. Put directly, the slope of the d-t graph is the velocity.
Of course, it only makes sense that if you can determine velocity from the d-t graph, you should be able to work backward to determine displacement from the v-t graph. If you have a v-t graph, and you want to know how much an object’s displacement has changed in a time interval, take the area under the curve within that time interval.
So, if taking the slope of the d-t graph gives you the rate of change of displacement, which we call velocity, what do you get when you take the slope of the v-t graph? You get the rate of change of velocity, which we call acceleration! The slope of the v-t graph, then, gives you acceleration:
Let's take a look at a sample problem from the June 2009 Regents Physics Exam:
Now that you've seen how to solve these types of problems, why don't you try a few on your own?
Acceleration-Time Graphs
Much like we did with velocity, we can make a plot of acceleration vs. time by plotting the rate of change of an object's velocity (its acceleration) on the y-axis, and placing time on the x-axis. For the purposes of the NY Regents Physics Course, we’ll always deal with a constant acceleration – all of our graphs will be a straight horizontal line, either at a positive value, a negative value, or at 0 (indicating a constant velocity). It’s important to understand, however, that in real life not all accelerations are constant.
When we took the slope of the d-t graph, we obtained an object's velocity. In the same way, taking the slope of the v-t graph gives you an object's acceleration. Going the other direction, when we analyzed the v-t graphs, we found that taking the area under the v-t graph provided us with information about the object’s change in displacement. In similar fashion, taking the area under the a-t graph tells us how much an object’s velocity changes.
Putting it all together, we can go from displacement-time to velocity-time by taking the slope, and we can go from velocity-time to acceleration-time by taking the slope. Or, going the other direction, the area under the acceleration-time curve gives you an object's change in velocity, and the area under the velocity-time curve gives you an object's change in displacement.
Let's take a look at an example problem to demonstrate this concept.